
Bitcoin Signals Flashing: Are We Ignoring History Repeating Itself?
Introduction
Bitcoin has been climbing relentlessly since the 2023 bull market began, but a series of technical signals suggest the ride higher may not be as smooth as many expect. While social media sentiment remains firmly in the “up only” camp, historical patterns tell a more cautious story. Moving averages, MACD crossovers, and long-term oscillator signals all point toward a corrective phase ahead. The big question: Are investors ignoring signals we’ve already seen multiple times this cycle?
Everyone Is Ignoring These Disastrous Signals For Bitcoin
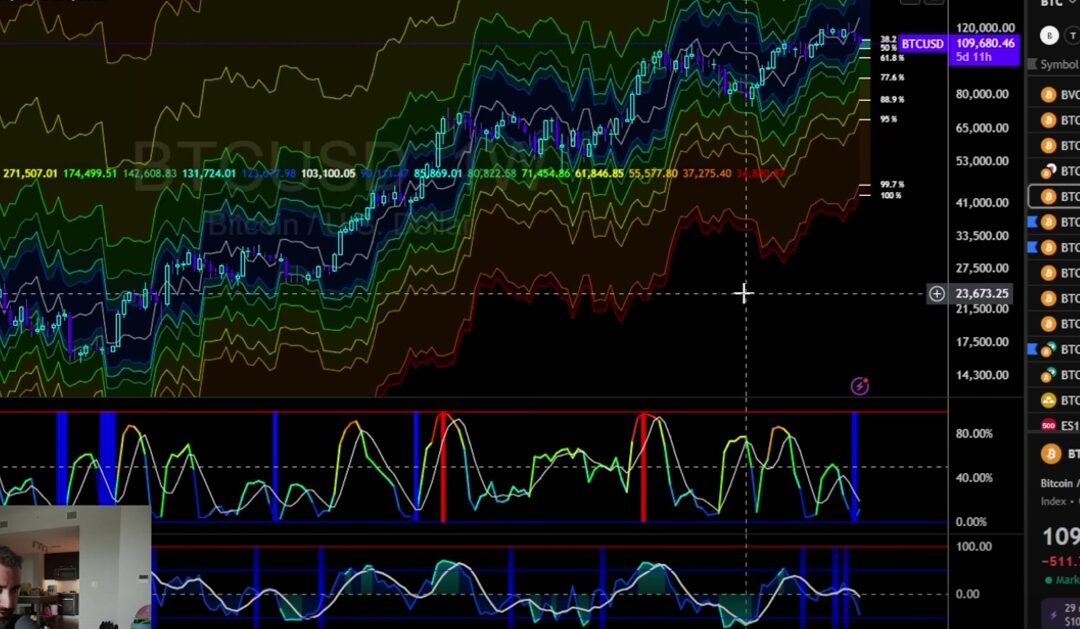
Short-Term Movements: Daily Price Ranges
In the immediate term, Bitcoin continues to trade in tight ranges. Historically, Tuesdays have been coin flips—equally likely to close positive or negative.
-
Upside range: ~112,500, likely to face resistance.
-
Downside range: ~108,250, already tested with a short bounce.
While scalpers may find opportunity here, the real story lies in the higher timeframes, where more consequential signals are firing.
Moving Average Crossovers: A Reliable Correction Signal
One of the most consistent patterns this cycle has been the red moving average crossing below the yellow moving average across multiple timeframes: 12-hour, daily, 2-day, and now the 3-day chart.
-
Every single crossover since 2023 has led to at least a correction to the green moving average.
-
On average, Bitcoin first bounces at this level before either consolidating sideways or breaking lower.
-
Current signals suggest a target near 106,000–107,000, with the possibility of an overshoot.
The pattern has played out too consistently to ignore.
The Weekly MACD: A Major Warning
Beyond short-term signals, the weekly MACD is flashing another downside cross. Historically in this cycle:
-
These crosses have preceded deep corrective phases lasting 100–180 days.
-
Typical drawdowns ranged from 12% to 27%.
-
Applying those probabilities now suggests a correction to ~100,000 at minimum, with potential risk into the low 90,000s.
This doesn’t mean a collapse, but it does argue for patience before loading up on long-term positions.
Long-Term Oscillator Trends
Other high-timeframe indicators confirm the caution:
-
Weekly RSI: Showing multiple bearish divergences, a classic cycle-top signature.
-
3-week timeframe: Momentum crossing down, historically tied to cycle highs and corrections.
-
5-day chart: If confirmed in coming closures, would target ~97,000.
Together, these signals suggest that sideways-to-down price action is more probable than a “V-shaped” recovery.
Why This Matters
The correction signals don’t invalidate Bitcoin’s long-term bull case. Historically, rate cuts and liquidity injections from central banks have fueled massive upside. But the first move when interest rates fall has often been down, not up. This aligns with the current technical backdrop: short-term pain before long-term gain.
Outlook and Action Plan
-
Short-term: Expect volatility around 108K–112K. Quick bounces possible, but resistance remains heavy.
-
Medium-term: Corrections toward 100K–106K appear likely over the next 2–3 months.
-
Long-term: Signals point to sideways consolidation before resuming the broader uptrend, potentially by late 2025.
Conclusion
The data is clear: while optimism dominates social media, the charts tell a more cautious story. Moving average crossovers, weekly MACD signals, and long-term divergences have historically preceded significant corrective phases. Ignoring these signals doesn’t make them go away.
In crypto, corrections are not the end of the story—they are the setup for the next leg higher. For long-term investors, patience may pay off more than chasing every bounce.
👉 Key Takeaway: Bitcoin may still be in a bull cycle, but signals strongly suggest a multi-month corrective phase before new highs. History doesn’t repeat exactly—but it does rhyme.

Crypto Rich ($RICH) CA: GfTtq35nXTBkKLrt1o6JtrN5gxxtzCeNqQpAFG7JiBq2
CryptoRich.io is a hub for bold crypto insights, high-conviction altcoin picks, and market-defying trading strategies – built for traders who don’t just ride the wave, but create it. It’s where meme culture meets smart money.